
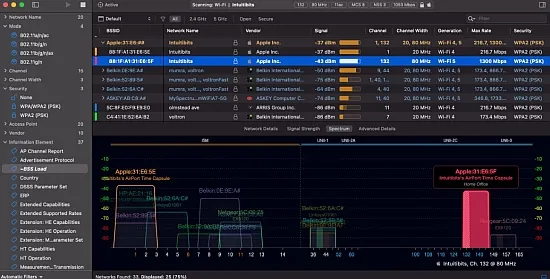
The modern wireless landscape demands tools that can translate raw radio data into actionable insight. This scanner delivers a granular view of every 802.11 network within range, exposing parameters that most consumer utilities hide. By presenting a sortable table enriched with hundreds of fields, it empowers network engineers, system administrators, and advanced hobbyists to pinpoint configuration flaws, performance bottlenecks, and sources of interference across small offices, campus environments, and large‑scale enterprises.
Built for both macOS and Windows platforms, the application embraces the full spectrum of Wi‑Fi standards—from legacy 802.11n to the emerging 802.11be. It operates across the 2.4 GHz, 5 GHz, and 6 GHz bands, supporting channel widths up to 320 MHz. Whether the host uses an integrated radio or an external USB adapter, the tool adapts to the available hardware, ensuring consistent analysis regardless of the underlying chipset.
Comprehensive Scan Modes
Three distinct scanning approaches let users balance speed, depth, and intrusiveness. An active scan rapidly probes for networks by transmitting probe requests, revealing even low‑signal SSIDs that might otherwise stay hidden. A directed scan narrows focus to specific channels or network names, making it ideal for targeted investigations such as troubleshooting a problematic access point.
Passive scanning listens silently to beacon and management frames, preserving the radio environment while capturing detailed timing and security information. This mode excels at detecting hidden networks and gathering data for compliance audits without influencing client behavior. The choice of mode can be switched on the fly, allowing analysts to start broad and then hone in on suspect frequencies.
Deep‑Dive Column Architecture
The heart of the interface is a highly configurable column system that can display anywhere from a few essential fields to over eight hundred technical attributes. Users craft custom column profiles for different tasks—one might emphasize channel utilization and PHY rates for RF planning, while another highlights authentication methods and cipher suites for security reviews.
Columns can be pinned, sorted, and filtered in real time, turning the table into a dynamic analysis grid. Advanced users can expose low‑level information elements such as 802.11k/v/r capabilities, spatial stream counts, and MCS indices, providing the depth required to diagnose subtle interoperability issues between mixed‑vendor equipment.
Advanced Visualization Techniques
Beyond the tabular view, the tool renders several graphical representations that make spectrum congestion instantly recognizable. Channel occupancy charts plot signal strength over time, while heat‑map style plots illustrate the distribution of networks across the 2.4 GHz, 5 GHz, and 6 GHz bands. Users can group results by SSID, physical radio, or vendor OUI to quickly assess deployment density.
- Channel‑by‑channel utilization bars highlight co‑channel interference.
- Signal‑strength timelines expose fading patterns and client mobility.
- Bandwidth width overlays reveal whether neighboring APs are using 20 MHz, 40 MHz, or wider channels.
- Color‑coding rules let you flag insecure protocols, legacy rates, or overloaded radios.
- Vendor grouping assists in identifying dominant equipment manufacturers in a given area.
These visual cues can be combined with custom filters to isolate problem zones, such as all networks operating on a congested 5 GHz channel or every AP advertising an outdated security suite. The result is a clear, at‑a‑glance dashboard that reduces the time required to formulate remediation plans.
Remote Sensors and Capture Integration
The application can ingest data from remote sensors or access points configured as passive probes, extending its reach to locations that are physically inaccessible or hazardous. Multiple sensors can be queried simultaneously, enabling side‑by‑side comparisons of RF conditions across floors, buildings, or outdoor sites without the analyst needing to travel.
In addition to live scans, the utility accepts import of packet captures (.pcap, .pcapng) and CSV exports from third‑party tools. This capability allows engineers to re‑visualize legacy data sets using the same column profiles and visualizations, facilitating post‑mortem analysis of incidents that were originally recorded with other sniffers.
Practical Troubleshooting Workflows
Custom filters let users craft logical queries such as “show only networks with WPA3 enabled” or “display APs operating on channels above 100 MHz.” Coupled with coloring rules, problematic entries instantly stand out, helping technicians prioritize remediation during site surveys. Annotations can be attached to individual rows, preserving notes like “relocate AP to channel 36” for future reference.
The combination of granular data, flexible visual tools, and remote acquisition makes the scanner a comprehensive companion for both proactive design reviews and reactive fault isolation. Whether planning a new Wi‑Fi rollout or auditing an existing deployment, the software equips users with the insight needed to optimize performance, security, and reliability across any wireless environment." , "meta_description": "Intuitibits WiFi Explorer Pro 1.2.0.0 delivers deep 802.11 analysis, multi‑band scanning, and advanced visualizations for Windows and macOS professionals.